天津

代码:TS000170
欢迎来到环球教育官方网站,来环球教育雅思培训,去全球,名师高徒,高分留学!
来源:环球教育
小编:长安 213雅思小作文其实就是看图说话,而看图说话其实是从我们幼年读绘本时便形成的本能,所以环球教育高飞老师认为写小作文本身是件非常自然而且有意思的事情。
一幅图形,有限的数据,无限种可能。但是,这并不意味着小作文是非常难写的;它是有规律可寻的,把握住这些规律后看图说话赋予小作文的灵活性和可能性就会给我们的写作带来很大的空间。
鉴于此,建议同学们在准备雅思小作文考试的过程中,注意梳理和把握典型图形的分析方法以及常见句型的整理运用。
譬如以下面这个题目为例:


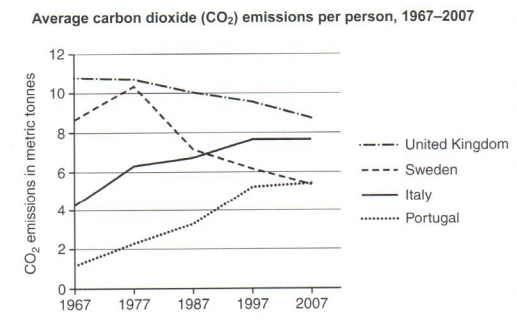
Given are figures providing differences of carbon dioxide emitted per capita in four European countries over the period from 1967 to 2007.
By far the largest amount of carbon dioxide emitted in 1967 was in the UK (a staggering 11 metric tonnes), compared to the lowest, a mere 1 metric ton in Portugal. Second in terms of emission, meanwhile, was approximately 9 metric tonnes in Sweden, which was almost twice as much as that in Italy.
After 1967, the following years witnessed a striking difference in average carbon dioxide emissions in four countries. As for Italy and Portugal, apparent is the fact that both saw rapid increases, to somewhere in the vicinity of 7.5 metric tonnes and 5.5 metric tonnes respectively in 2007. In stark contrast, however, the amount of carbon dioxide emitted in the UK plunged to a low of 9 metric tonnes in 2007, when it was still the largest. Different from that in the UK, in 1977, Swedes' emission soared to some 10 metric tonnes, before slipping to 5.5 metric tonnes in 2007.